By John Hunter, author of the Curious Cat Management Improvement Blog.
W. Edwards Deming wrote Some Statistical Logic in the Management of Quality to fill in some of the missing links in the use of statistical methods, with special reference to responsibilities at the management level for effective mobilization of statistical knowledge and skills.
In the paper, he describes statistical control of quality as a system, not a bag of techniques, focuses on statistical methods in improvement of operations. He provide 24 examples of uses of statistical methods in various stages and types of work, for example: feedback to the production worker, feedback to management, consumer research, tests of drugs and of treatments, and the design of meaningful information systems.
This 22 page paper was delivered by Dr. Deming at the All India Conference on Quality Control, New Delhi, 17 March 1971.
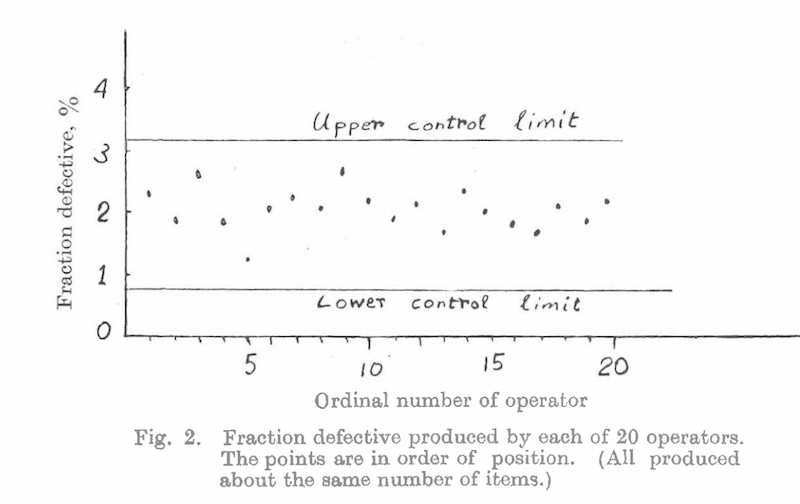
Confusion between common causes and special causes is one of the most serious mistakes of administration in industry and in public administration as well. Unaided by statistical techniques, man’s natural reaction to trouble of any kind, such as an accident, high rejection-rate, stoppage of production, is to blame the operators. Anything bad that happens, it might seem, is somebody’s fault, and it wouldn’t have happened if he had done his job correctly. The worker knows what his job is, yet he turned out defectives. Sounds as if he doesn’t care.
This statement is very often absolutely true, but the truth of this observation will not solve the problem. It may be that workers are putting into the job all that they ever will, under the circumstances. The cause of the trouble may be common to all the machines – e.g., poor thread, the fault of management, whose policy may be to buy thread locally or from a subsidiary. Demoralization, frustration, and economic loss are inevitable results of attributing trouble to some specific operator, foreman, or machine, or other local condition, in a situation where the trouble is actually common (environmental), affecting all operators on all machines, and correctable only at a higher level of management.
The specific local operator is powerless to operate on a common cause.
…
Fortunately, confusion between the two sources of trouble can be eliminated with almost unerring accuracy. [with the use of a control chart]
…
A common mistake, even now [as Dr. Deming wrote this in 1971 he meant even in 1971, sadly it is still true even now in 2015 though thankfully more companies due better today than was the case 40 years ago], in quality control programs, and amongst nearly all writers of text-books on the subject, is to assume that they have solved all the problems of the production-line, once they have weeded out most of the special causes. The fact is, instead, they are at that point just ready to tackle what are usually the most important problems, namely, the common or environmental causes, faults of the system.No fundamental improvement of the production-line will take place until management has a quality control system that works on common causes as well as special causes. [and does so by applying the strategies to address each type of problem properly]
The wisdom provided in this paper written so long ago still provides value to those seeking to improve the performance of their organizations today.
Some Statistical Logic in the Management of Quality is one of over 60 articles by W. Edwards Deming we make available on our website.
Related: On the Use of Theory by W. Edwards Deming – Control Charts in Health Care – The Red Bead Experiment with Dr. W. Edwards Deming – Using Control Charts to Aid in Improving the Classroom Learning Environment
Interestingly he discusses the impact of computer generated data and the potential problems when the data produced is not useful. Remember this was written in 1971 long before personal computers, excel, laptops, the world wide web, iPads…
An information-system is not to be measured in the volume of figures it produces, but in the effectiveness, utility. An information system, to be effective, must produce figures… that will help to guide a course of action.
I think that many of us, even today, are deluged with data that doesn’t help guide a course of action.