Guest post by John Hunter, author of the Curious Cat Management Improvement Blog (since 2004).
Dr. Walter Shewhart developed the control chart in the 1920s while working for Bell Telephone. The text of the memo that including the image of the control chart:
A few days ago, you mentioned some of the problems connected with the development of an acceptable form of inspection report which might be modified from time to time, in order to give at a glance the greatest amount of accurate information.
The attached form of report is designed to indicate whether or not the observed in the percent of defective apparatus of a given type are significant; that is, to indicate whether or not the product is satisfactory. The theory underlying method of determining the significance of the variations is the value of p is somewhat involved when considered in such a form as to cover practically all types of problems. I have already started the preparation of a series of memoranda covering these points in detail. Should it be found desirable, however, to make use of this form of chart in any of the studies now being conducted within the Inspection Department, it will be possible to indicate the method to be followed in the particular examples.
– – W. A. Shewhart
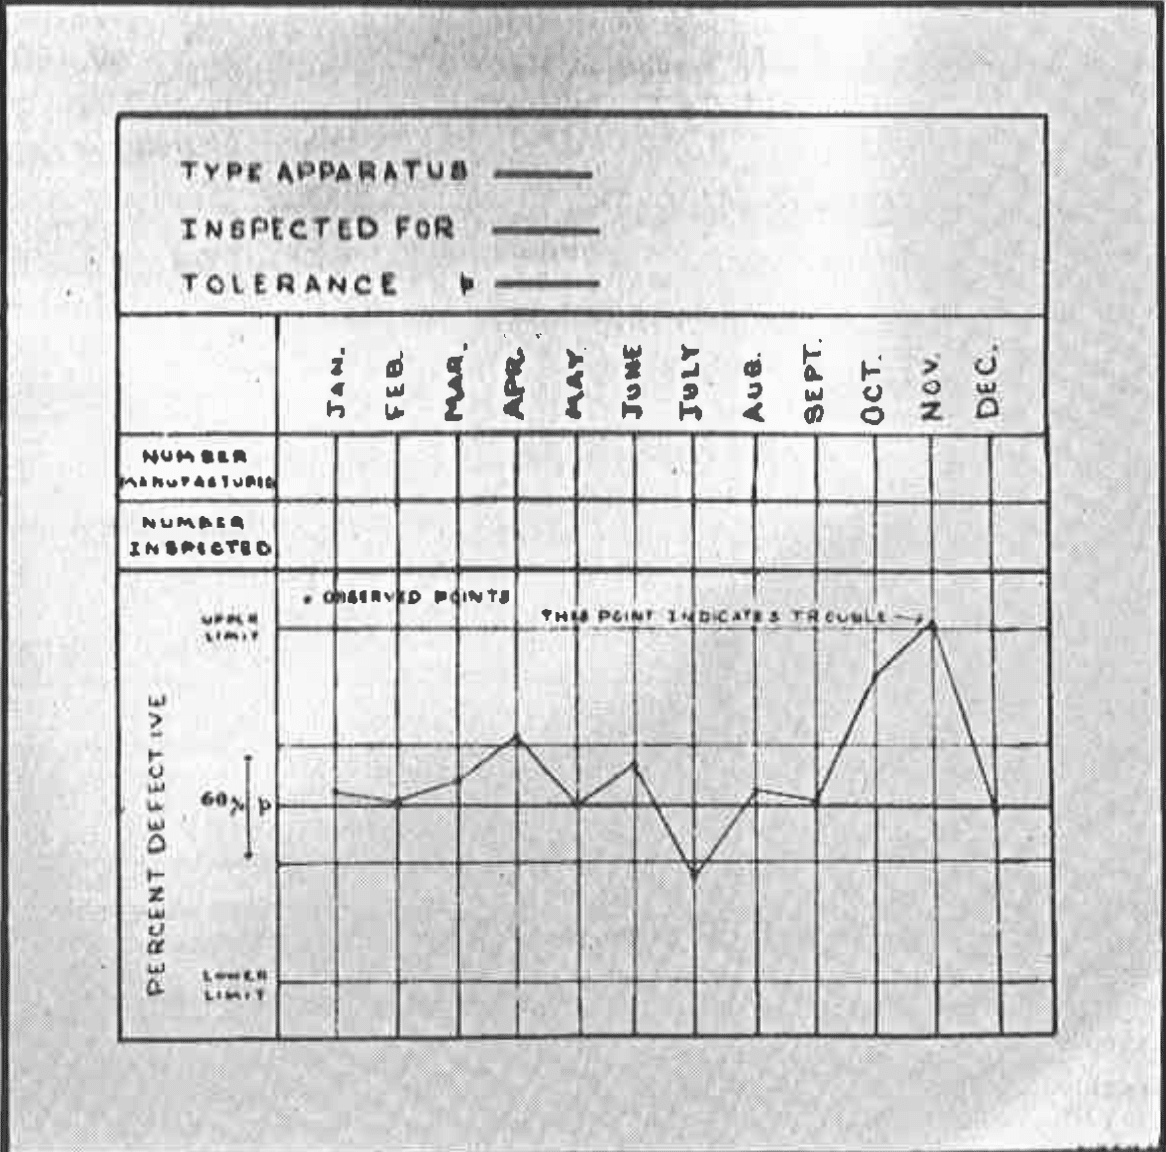
From this beginning the control chart has grown to become an invaluable tool in improving processes.
Related: Remembering Walter A. Shewhart’s Contribution to the Quality World – Process Behavior Charts are the Secret to Understanding the Organization as a System – The Influence of C. I. Lewis on Walter Shewhart and W. Edwards Deming – Knowledge of Variation