Guest post by John Hunter, founder of CuriousCat.com.
Working with data is something that doesn’t come naturally to many people. But it is important to develop your understanding of data to manage well within an organization, applying the Deming management system. In this post, I take a look at how understanding data is important with an example from our current ongoing health care crisis.
The USA is now experiencing more than 2,500 deaths a day due to COVID19. This number of deaths exceeds the levels for any time during the pandemic other than December 2020 to February 2021.
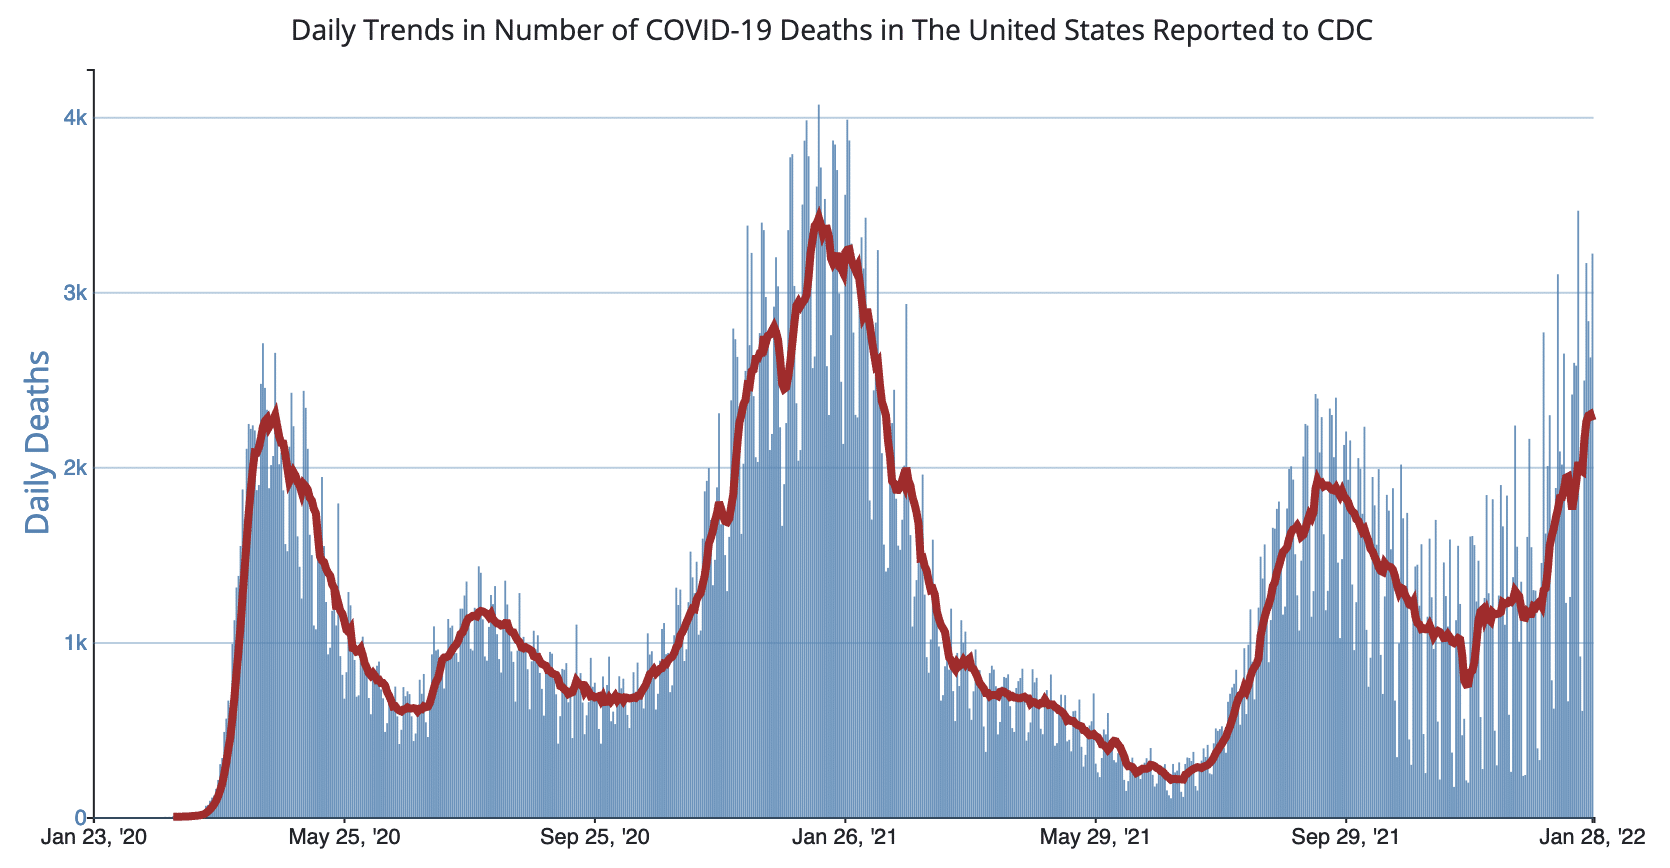
Chart from USA Centers for Disease Control and Prevention
This seems unlikely. Why would the death rate soar again when so many people have greatly enhanced safety by taking the vaccines and booster shots? Why would the death rate soar if the omicron variant has a lower incidence of severe symptoms compared to previous variants of COVID19?
A bit of understanding of data makes this outcome much less surprising. To make things easier to understand, I’ll simplify the data used to understand how this can happen.
The vaccines don’t eliminate the risk of severe symptoms or death, but they do reduce them to a huge extent so for this example, I will simplify the data to say that dying is eliminated as a possibility. About 64% of the population in the USA are vaccinated (with 76% having at least one of 2 required vaccination shots, and about 40% of those that have received all the initial vaccination shots have the additional protection from getting a booster shot).
If the omicron variant is 300% more transmissible, and we can increase the actual transmission to 400% due to a reduction in care taken by people to wear masks and physically distance, that means many more people will become sick over the course of months. The spread is actually somewhat complicated to explain with data, but if we just simplify it, we can look at how many people get infected with omicron who have not been vaccinated.
Over the past two years, varying levels of care for the entire society have been shown by taking precautions such as physical distancing, masking and isolation and quarantine when having symptoms or after close exposure to an infected person. The combination of omicron being much more transmissible, and people being more lax with their efforts to protect themselves and others, is a bad combination which greatly increases how many people become infected.
The rate of death for those infected with omicron is complex. The entire population that gets sick includes sub-groups that have very different outcomes. Those vaccinated and boosted have extremely low death rates. Those that had a previous bout with COVID19 have lower death rates than those that never had a previous illness (though the data seems clear that it is significantly higher than those that have been vaccinated). Those with vulnerable immune systems (due old age or other reasons) are at a greater risk than others. For this illustration, I will simplify the data again and just say there is a 0% risk for those vaccinated and a .35% death rate for others (and a 1% death rate for vaccinated that caught other variants).
So if in a previous month, 150,000 unvaccinated people caught COVID19 each day, and there was a 1% death rate, that equals 1,500 deaths a day, which is approximately how many deaths from COVID19 the USA has been experiencing each day. If you then decrease the death rate to .35%, you could easily initially think that the deaths per day should decrease to 525 (150,000 * .0035 = 525). But if, instead, this new variant resulted in many more people being infected so you now had 600,000 cases a day, then you end up with 2,100 (deaths a day in the USA due to COVID19). We actually are now experiencing about 2,500 deaths a day.
Of course, the real situation is much more complex with many interacting factors. For example, while the data does seem to indicate that the symptoms for those infected with the omicron variant are less severe on average, some of the treatments that worked to manage severe symptoms in previous variants do not work on the omicron variant. Also the death rates vary a great deal within those who are infected with omicron. And, of course, many bad outcomes happen to those that are infected short of death.
For the sake of a simple example of how a less deadly variant can easily result in more deaths, these simplifications suffice. If you were really working on understanding this system and improving the results, you would have to be careful to include more detail to have a more accurate understanding of how the system works. But, for this example, that simplicity is helpful in understanding how an appreciation of the system and data can result in a deeper understanding of risks.
The data on the number of infections in the USA has never been good. The data shows confirmed cases, but huge numbers of cases have never been confirmed (but they still happened). And as testing is even less complete now than it was previously, that means the counts for infections are likely more undercounted today than they were earlier.
There are all sorts of complexities around transmission rates while infected. The evidence is strong that if you are vaccinated, you are less likely to transmit the virus to as many people as those who are not. And there is a big difference in transmission rates by those that take care to protect others (wearing masks, physically distance, isolation when it is warranted) and those that do not.
But an understanding of data lets you know that the death rate is not just about how severe the symptoms are on average. That is an important factor. The other critical factor is how many people get sick. And then there are many other potentially important factors (such as what if the hospital system gets overwhelmed so life saving measures cannot be given to all those in need, or what if the variant does not respond to certain treatments that worked for previous variants).
With an understanding of data, you can realize that risk is not just a measure of how risky it is for each person that gets sick. If the number getting sick greatly increases, even if it is more likely each of those people survive, it is possible for increasing deaths from a variant with less severe outcomes on average.
The same understanding of data applies to other instances of using data to understand the implications of changes. You need to understand the system and how changes will impact that system. And doing so isn’t as simple as looking at one variable and saying, “Well that one variable is moving in a positive direction so things will get better.” You must go beyond the first implication of some piece of data you are looking at. You must understand the system and understand how that change will impact the whole system.
On a related note, it is amazing to me what these past two years illustrate about human psychology. I would not have predicted that society would come to accept 1,500 deaths a day in the USA in the way that we have. I certainly would not have expected our reaction to such a pandemic after seeing how people react to other risks and large losses of lives. At least for me, how this crisis has unfolded over 2 years has been a reminder of how flawed my guesses about what people care about and how they will react to circumstances. Adjusting your understanding to new evidence is an important part of managing. Doing so is often quite difficult.