By John Hunter, founder of CuriousCat.com.
Understanding Variation by Thomas Nolan, Rocco J. Perla and Lloyd Provost. There have been large changes in the use of data since the publication of Understanding Variation, by Thomas Nolan and Lloyd Provost. The new article discusses how to use an understanding of variation when working with large datasets (for example, government data).
From the current article:
Shewhart’s method is empirical and designed to minimize the risk of over and under-reacting to the data. “An assignable [special] cause of variation, as this term is used in quality control work, is one that can be found by experiment without costing more than it is worth to find it.”
In other words, if it costs more to find the problem than the value in addressing it, that is not economical.
In most applications, for points that fall outside of Shewhart’s three-sigma limits, it will be cost effective to search for a specific cause or to design a test to understand it.
This is one of the most fundamental points that is often not appreciated as clearly as it could be. An indication of a special cause is a signal that the most useful strategy to improve is to look for an assignable cause and fix that specific issue. The control chart is meant to help you identify those special causes in order to use an improvement strategy based on looking for an assignable cause – finding what was special about that result.
When results are not satisfactory but no indication of an assignable cause exists that doesn’t mean we have nothing to do. That means we have to focus on improving the system to improve all the results from the system. Seeking to find assignable causes and fix them for individual results that are within the control limits is just a poor strategy to use. The better strategy in such cases (with no indication of an assignable cause) is to use tools and thinking that address systemic fixes.
Most of the time we should be focusing on the entire systems and figuring out how to improve that. Unfortunately we often find ourselves focusing on one bad results and trying to assign blame for that to some specific thing (or person) and seeking to improve that way. That is isn’t a very effective way to improve.
Another important idea the article discusses is the use of stratifying your data in order to help understand the data. For example, looking at the high school dropout rate by low, medium and high family income.
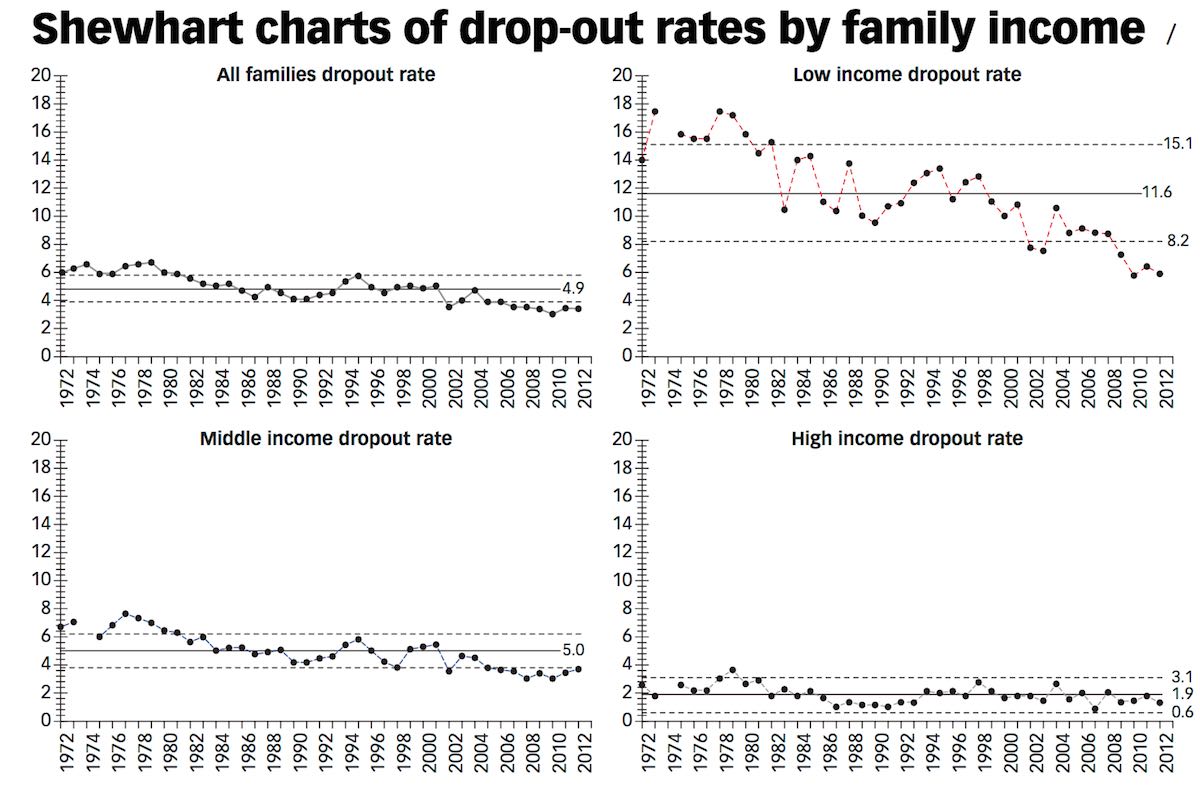
Stratification of data is helpful when there are significant difference in different groups of data. You can think of these as results from different processes – where different solutions may be useful. It may be for example, that students from low income families benefit from certain improvements that have no impact on students from high income families. Stratifying the data helps you better understand your system and better measure the results of changes. It can be that without stratifying the data that improvements that are very significant are lost because the signal of that improvement is not strong enough when looking at all the data. But if you stratify the data then you can clearly see a change (for example to the system for students from low income families) was successful.
Related: What Role Does/Should The Deming System of Profound Knowledge Play in the World of “Big Data”? – We Need to Understand Variation to Manage Effectively – Special Cause Signal Isn’t Proof A Special Cause Exists – How to Create a Control Chart for Seasonal or Trending Data – Deming Lecture by Dr. Jeff Wu on Quality Improvement from Autos to Nanotechnology